
Reporting Glossary
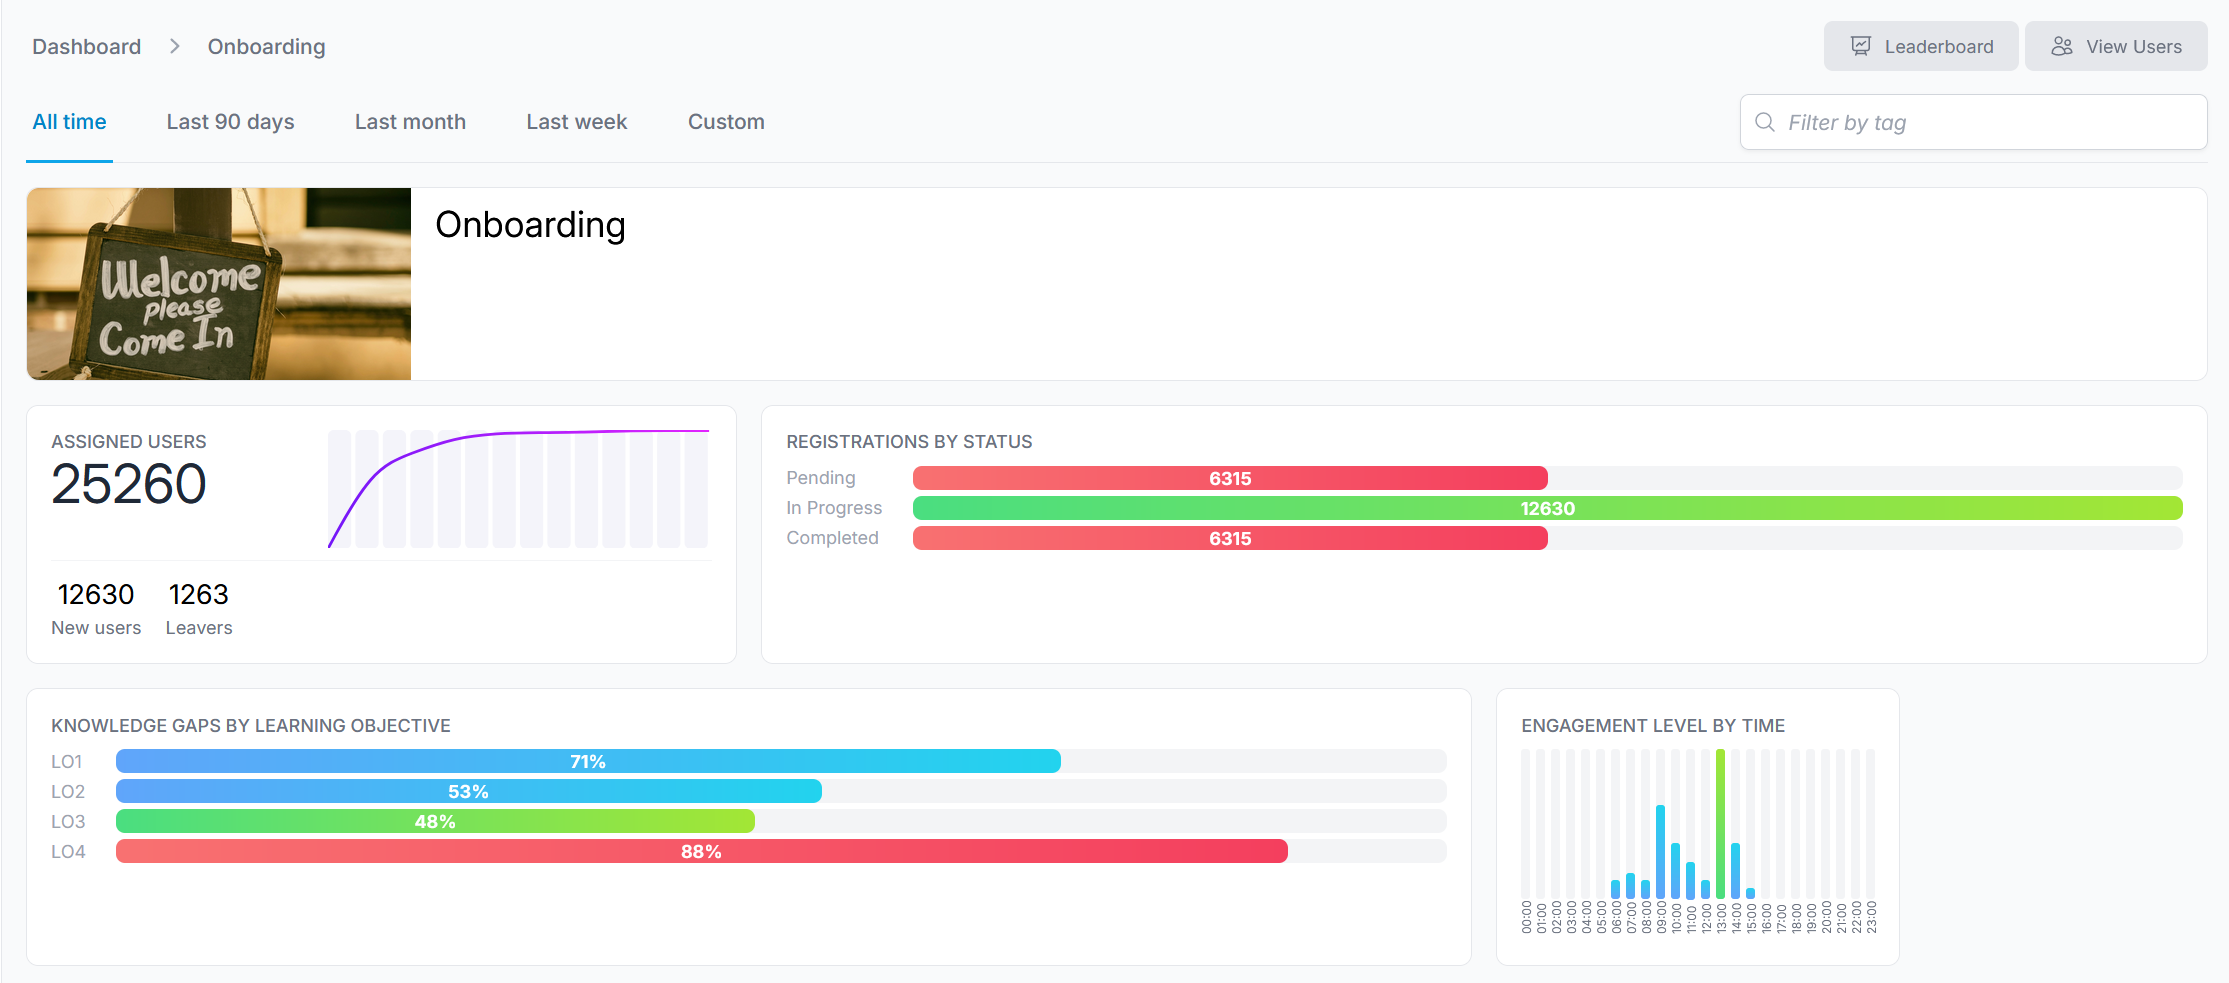
The reporting page within the BentoBot administrator view aims to give an overview of how learners are engaging with their content. The page is tabbed, so you can view all-time data, or data within a specific time period. Let's dive into what data is available! Terms are grouped under their tile's header, left to right, top to bottom.
We'll also dive into the Leaderboard, View User, and Course-specific dashboards.
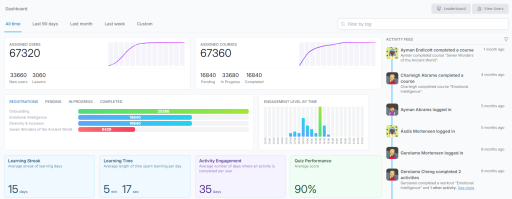
Dashboard
Assigned Users
An assigned user is a user that has content available for them to complete.
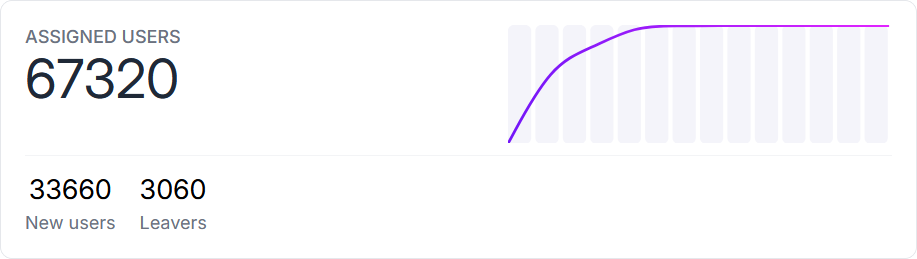
New user
A user that has content available for them to complete, and was added to the tenant during the specified time range.
Leavers
Users that are not flagged as enabled on the tenant.
Assigned Courses
Any Course registration - a user registered on a Course twice will count as 2 assigned Courses.
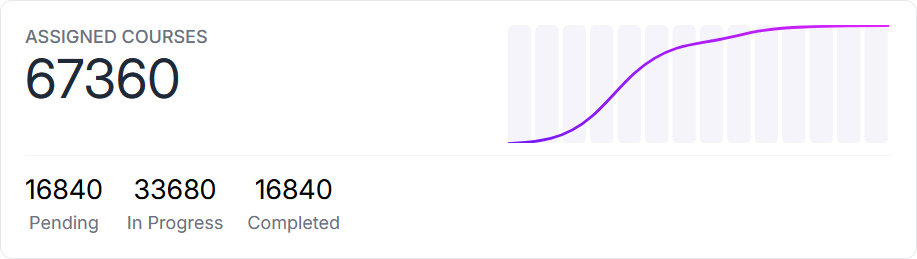
Pending
An assigned Course that has has content to be completed, but has not completed any yet.
In Progress
An assigned Course that has some content completed, but still has content to be completed.
Completed
An assigned Course that has been completed by the registered user.
Abandoned
An in progress or pending assigned Course that hasn’t had any content completed in 21 days.
Progress
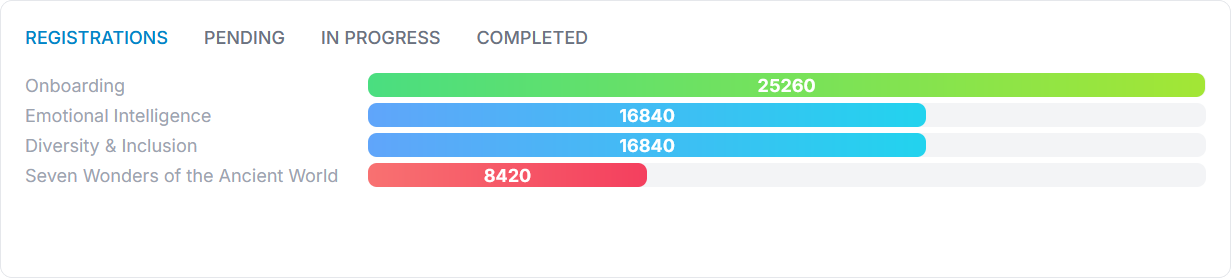
This tile is a breakdown of the Assigned Courses tile, showing the top 5 Courses with the most users.
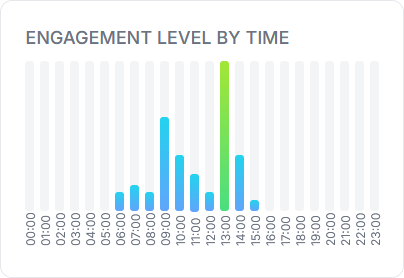
Engagement Level By Time
The number of valid engagements (starting content, completing content, logging into BentoBot client) per hour. You can get an idea of when users prefer to log in to complete their content over the course of a day.
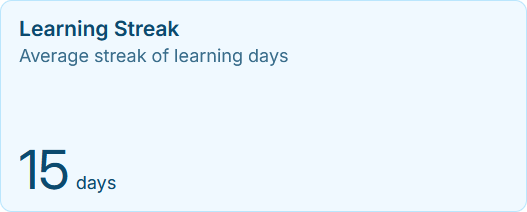
Learning Streak
Average number of consecutive days where some content was completed per user.
Note: this is not an average of max streaks, but an average of all streaks within the time period, including 1 day streaks.
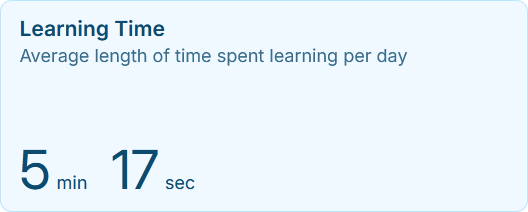
Learning Time
The average time spent on content per day per user.
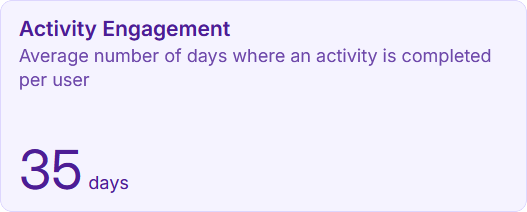
Activity Engagement
The average number of days where an activity is completed per user.
Quiz Performance
The average percentage of correct answers per quiz.

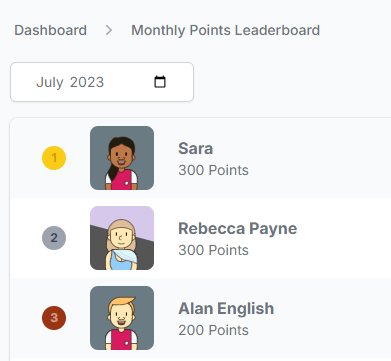
Leaderboard
This page shows a monthly breakdown of the users who have earned the most points in that time period.
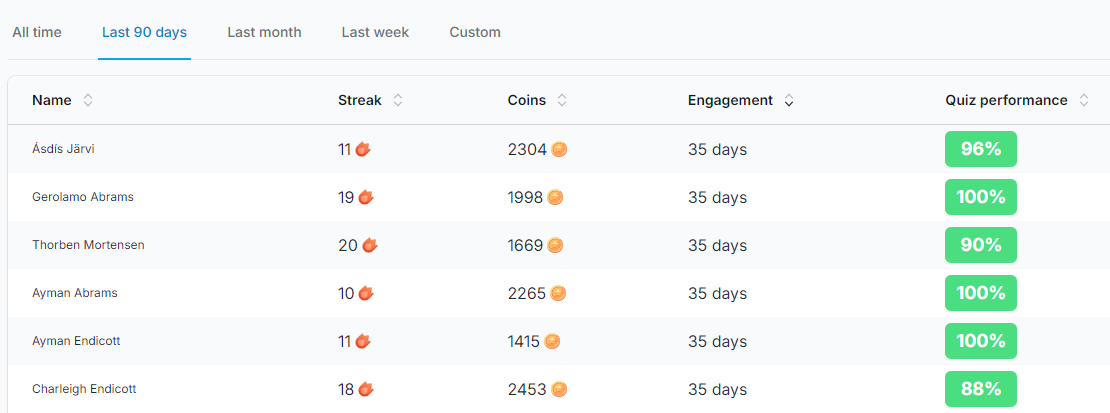
View Users
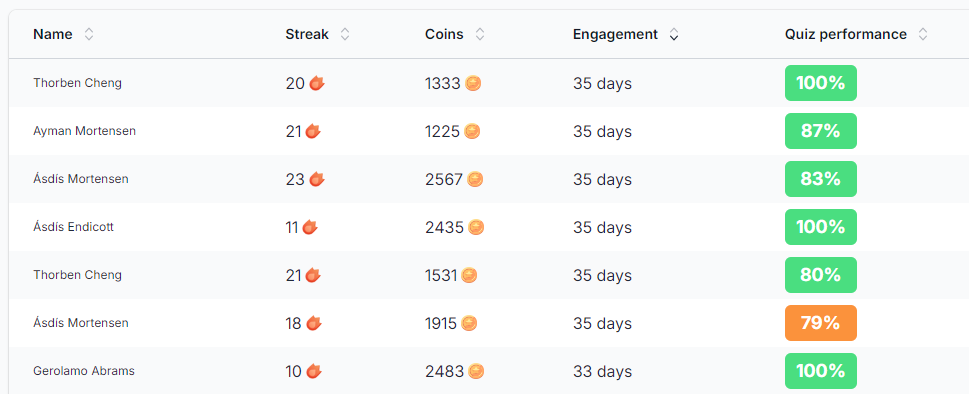
Lists all users, with ability to sort by their streak, coins earned, engagement, quiz performance, or the days since their last activity was completed. This data may also be exported.
Course Dashboard
There is a tile for each Course with at least one registration. Clicking on one will open up the Course-specific dashboard, with even more insights. As before, this dashbard is also tabbed, so you can filter by whichever time period is most suitable.
Assigned Users
This is the same as the general Dashboard, but specific to the chosen Course.
Registrations by Status
This is a Course-specific breakdown of the registration statuses as outlined under the Assigned Courses header above.
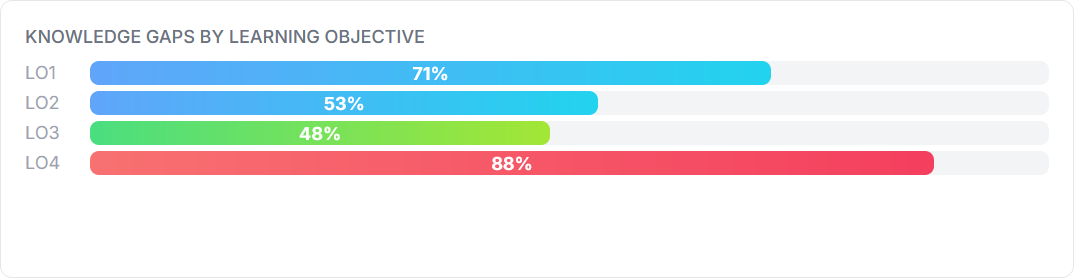
Knowledge Gaps by Learning Objective
The percentage of incorrect answers per learning objective out of all incorrect answers. For example, in the below screenshot, users got 88% of the questions incorrect for questions linked to LO4.
Leaderboard
See Leaderboard above, with this page being specific to the Course selected. Here, you may filter by specific quizzes on the selected Course.
View Users
See View Users above, with this page being specific to the Course selected.
Want to know more about how we can help you?
Power up your performance: find out how with BentoBot or try our free BentoBot demo (it only takes 10 seconds to get started!)